
How Much Does an LMS Cost?
Learning systems range from nearly free, highly self-service products to complex enterprise platforms that cost hundreds of thousands of dollars per year or more. That range is real because buyers are not purchasing one standardized product under one standardized pricing model.
The actual price depends on scale, use case, learner behavior, license model, modules, AI, implementation, integrations, migration, support and the vendor’s own economics. A useful budget therefore starts with the business scenario, not an assumed price per user.
Learning System Budget Planning Ranges
The table below groups typical deployments into five broad tiers. Use it to find a reasonable starting neighborhood for your budget, not to predict a price.
Tiers are defined by the whole deployment, not learner count alone. A 50,000-learner employee compliance program on standard configuration can land in a lower tier than a 5,000-learner certification business with ecommerce, several integrations and years of history to migrate.
| Tier | Typical deployment profile | Annual software | Implementation | First-year investment |
|---|---|---|---|---|
| Entry / Small | One audience, standard configuration, few or no integrations, self-service setup | Free to $10K | $0 to $5K | Under $15K |
| Growth | One primary audience, a few standard integrations such as SSO or HRIS, assisted implementation | $10K to $40K | $5K to $25K | $15K to $65K |
| Mid-Market | Multiple audiences or external learning, ecommerce, several integrations, some data migration | $40K to $100K | $25K to $75K | $65K to $175K |
| Large | Several business units, regions or brands, complex integrations, data and content migration, premium support | $100K to $250K | $75K to $200K | $175K to $450K |
| Enterprise / Complex | Global or highly regulated programs, many integrations, custom requirements, managed services | $250K+ | $200K+ | $450K+ |
These are broad planning ranges, not vendor quotes. Use case, learner behavior, license model, integrations, migration, support, AI, additional modules and vendor economics can move an organization substantially within or beyond these ranges. The ranges exclude internal staff time and ongoing managed services.
Published vendor price lists mostly come from simpler, standardized products, so they describe the lower tiers well and the upper tiers poorly. Mid-market and enterprise pricing is negotiated and varies more. A planning range gets you into the right neighborhood. The next steps are to define your own business scenario and then test it against the market.
Build the Budget in Layers
Separate first-year investment from recurring operating cost.
The first year may include the software license, implementation and migration, integrations, administrator preparation, premium support, add-on modules, AI and other professional services. Some vendors bundle several of those items. Others present them as separate lines. If you are replacing a system, include any period when you pay for both platforms and any cost of extracting data from the current vendor.
Ongoing years typically include the recurring software license plus any continuing support, AI usage, modules, managed services and growth-related charges. Watch for less obvious recurring costs too: integration maintenance, off-the-shelf content libraries, ecommerce payment fees and renewal increases.
The budget should also reflect internal responsibility. A self-service or assisted implementation may reduce the provider invoice but require more time from learning, IT, data, project management and business stakeholders. The objective is not to capture every internal minute. It is to make sure the organization has budget and capacity for the work that must happen.
Price Where You Are Going
A vendor quote normally reflects today’s requirements and usage. A buying decision should reflect the environment the organization expects to operate in over the next several years. Forecast the learner or usage metric for Year 1, Year 2 and Year 3, along with major audiences, modules, AI usage and service needs that are likely to change.
This matters because vendor pricing curves behave differently. The apparent low-cost vendor in Year 1 may not remain the low-cost vendor in Year 3. Price the organization you are becoming, not only the organization you are today.
Normalize Every Vendor Into the Same Scenario
Talented Learning compares vendor economics by normalizing the business scenario, not the vendor pricing model.
Start with one business forecast, then let each vendor translate that forecast into its own billable metric. A customer education program might forecast:
- 50,000 eligible or registered customers
- 12,000 learners who take at least one course during the year
- 3,000 peak monthly active users
Vendor A prices registered users, so it quotes against 50,000. Vendor B prices monthly active users, so it quotes against activity that peaks around 3,000. Vendor C offers an enterprise license that covers the whole population. Do not force those three quotes into an artificial per-user number. Each vendor prices the same expected operating reality according to its own commercial model, and you compare what each one actually costs.
Hold required functionality, implementation scope and service expectations constant in the same way. This makes very different commercial models comparable without pretending they work the same way.
Build a Three-Year TCO
Use the following structure for every finalist. Record the scenario assumptions first, then the costs. Keep the assumptions identical for every vendor even when the vendor’s pricing metric differs.
| Scenario assumptions | Year 1 | Year 2 | Year 3 |
|---|---|---|---|
| Registered or eligible learners | |||
| Active learners (or other usage metric) | |||
| Audiences and required modules | |||
| Expected AI usage |
| Costs | Year 1 | Year 2 | Year 3 | 3-Year Total |
|---|---|---|---|---|
| License | ||||
| Implementation (including migration and integrations) | ||||
| Support and services | ||||
| Modules and add-ons | ||||
| AI | ||||
| Other (content, ecommerce fees, environments) | ||||
| Internal effort (optional) | ||||
| Annual cost | 3-Year TCO |
The bottom-right cell is the three-year TCO. The right-hand column shows the three-year total for each cost category, which is where the real differences between vendors usually appear.
Example: When the Year 1 Leader Is Not the Best Value
The figures below are hypothetical. They show how one scenario can reorder vendors over time.
Scenario: a customer education program with 20,000, 30,000 and 40,000 registered users in Years 1 to 3. Of those, 6,000, 10,000 and 15,000 are active each year. The program requires ecommerce and AI-assisted authoring.
- Vendor A (named): $2 per registered user, $35,000 full-service implementation, $8,000 per year ecommerce module and $10,000 per year AI module.
- Vendor B (active): $5 per active learner with a 7,500-learner minimum and $9 overage above that, $15,000 assisted implementation, $6,000 per year premium support and AI credits of $4,000, $8,000 and $14,000.
- Vendor C (enterprise): $65,000 per year covering up to 50,000 registered users with ecommerce and AI included, plus a $40,000 implementation.
| Annual cost | Year 1 | Year 2 | Year 3 | 3-Year TCO |
|---|---|---|---|---|
| Vendor A (named) | $93,000 | $78,000 | $98,000 | $269,000 |
| Vendor B (active) | $62,500 | $74,000 | $125,000 | $261,500 |
| Vendor C (enterprise) | $105,000 | $65,000 | $65,000 | $235,000 |
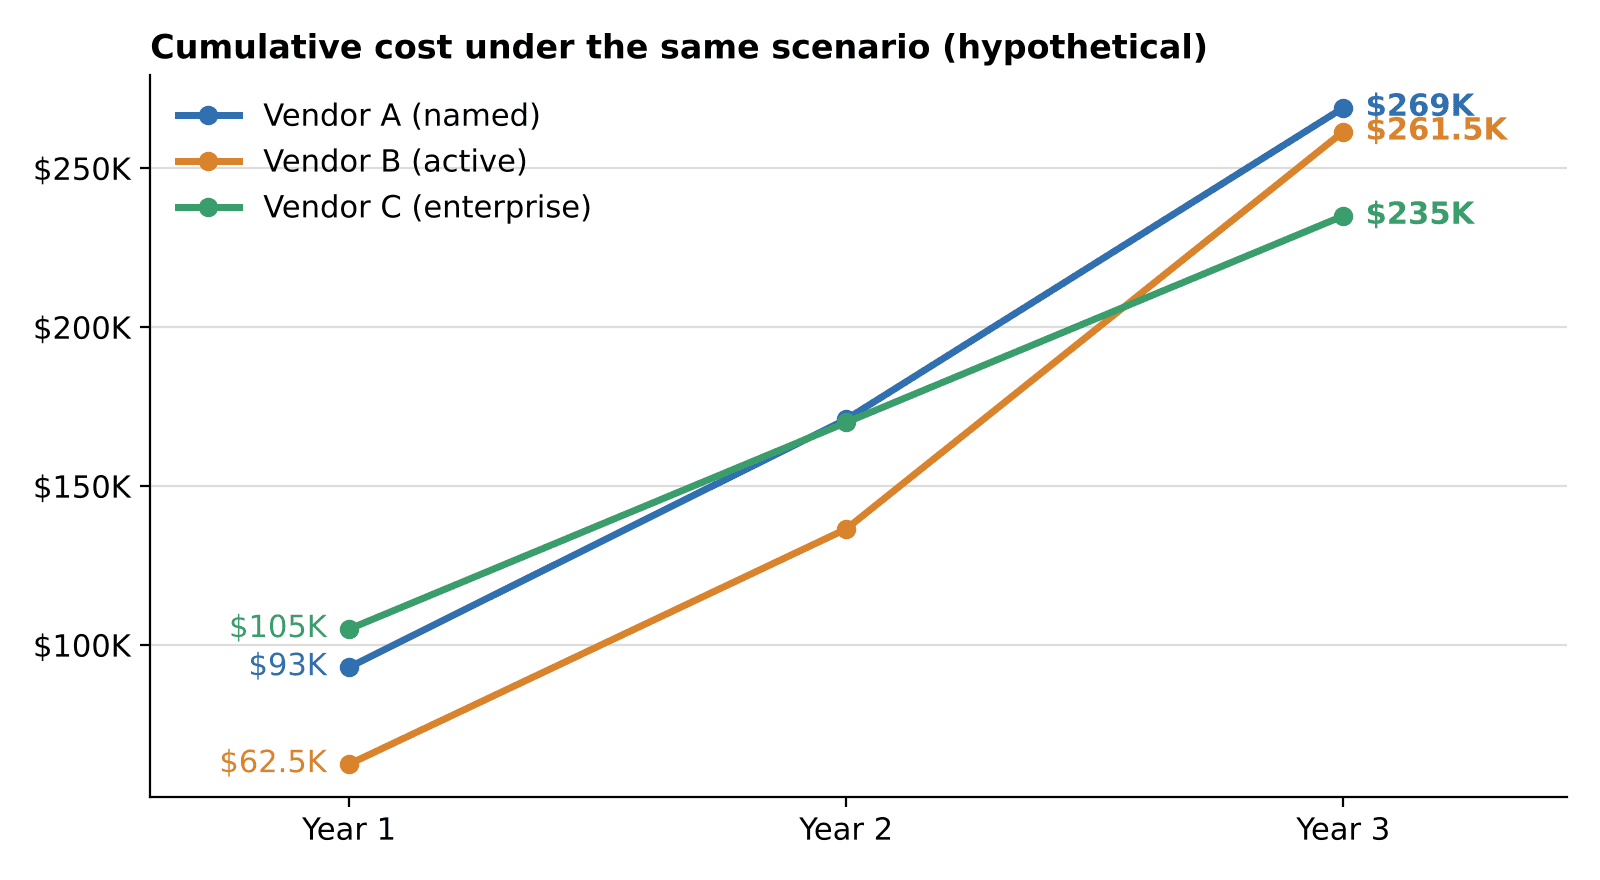
Vendor B is the least expensive in Year 1 and still leads after two years. Once active learners pass its 7,500 band, overages make it the most expensive vendor in Year 3. Vendor C costs the most in Year 1 but delivers the lowest three-year TCO. Vendor B’s lower implementation fee also means the buyer’s team does more of the work. A better-negotiated volume band could change Vendor B’s position, which is exactly why these variables belong in negotiation.
Compare More Than the Final Total
The three-year TCO is the most useful single financial comparison, but the category totals explain why vendors differ.
Compare Year 1 against the recurring years. Identify where each proposal is sensitive to growth, overages or optional functionality. Confirm that each vendor has priced the same required scope. A vendor with a low license may require expensive implementation. A higher-priced platform may include modules that competitors sell separately. The goal is to understand the economic structure, not just rank three totals.
Ask Vendors to Price Your Scenario
Normalization is easiest when it starts in the RFP. Give every vendor the same Year 1, Year 2 and Year 3 assumptions and ask for pricing in the same format: license by year, the pricing unit and band, implementation scope and fee, support level, modules, AI, overage rates and renewal terms. The LMS RFP Starter Kit can help structure the request.
Negotiate the Variables That Matter
Negotiation should focus on the commercial variables that can materially change the three-year economics: volume bands, overage rates, minimum commitments, implementation scope, future modules, support levels, AI usage, renewal increases and multi-year commitments.
A large Year 1 discount can look impressive while doing little to improve the total economics. Renewal terms deserve particular attention because annual increases compound over the life of the contract. Ask for any increase cap in writing.
Contract language should accurately reflect the agreed pricing model and scope, but this page is not legal guidance. The financial objective is simply to reduce avoidable surprises and make future cost more predictable. When renewal approaches, the LMS Renewal Scorecard can help you decide whether to renegotiate or replace.
When a Planning Range Is Not Enough
Public planning ranges are useful for establishing an initial budget and testing whether an internal expectation is realistic. They become less reliable when an organization needs a defensible number for executive approval, procurement or a complex modernization initiative.
At that point, the best estimate comes from a defined business case, audiences, use cases, requirements, integration assumptions, implementation model and expected growth. Those inputs can then be tested against the market.
That is the purpose of Talented Learning’s LMS Replacement Readiness Review: put a practical box around what the organization needs, validate the vision against relevant vendors and use anonymous, non-binding vendor feedback to establish a more credible investment range before a formal selection begins.
